")
")
")
Monitoring Your Project
During your multimomentanalysis you might want to verify if everything is working as planned. We offer a variety of tools for monitoring your projects. Go to Monitoring > Monitoring and have a look at them. Every tool is displayed in a separate box. We developed three different tools that cover multiple parts of your project. Please be aware, that the monitoring tools are only working during the test and running phase of your multimomentanalysis.
Performance Indicators
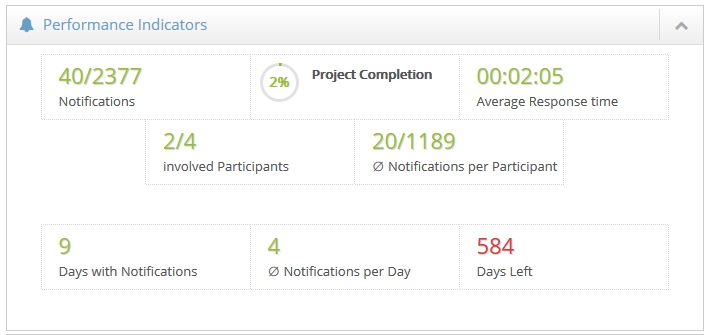
This tool contains multiple indicators that help you assess the quality of your multimomentanalysis. Please be aware that the numbers and figures displayed in this tool highly depend on your planning settings. To access those settings go to Project Setup > Planning Data. The following information are provided by this tool:
Notifications: The total number of answered notifications and the total number of notifications necessary.
Project Completion: The progress of your multimomentanalysis in percent.
Average Response time: The average amount of time it takes a participant to answer a notification.
Involved Participants: The total number of participants that answered at least one notification since the beginning of your multimomentanalysis.
Average Notifications per Participant: The average number of notifications answered by participants.
Days with Notifications: The total amount of days during which participants answered notifications.
Average Notifications per Day: The average number of answered notifications by day.
Days Left: The total amount of days remaining until your multimomentanalysis is completed (based on the two previous indicators).
Notations per Day
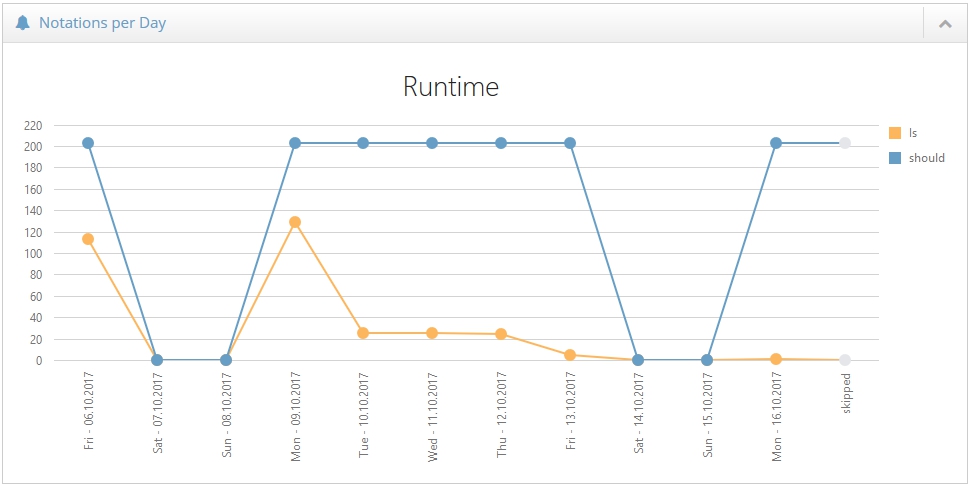
The notations per day are visualised using a line chart. It displays the total amount of answered notifications in the last few weeks. This chart helps you discovering days with increased activity as well as days on which your participants are less active. The total number of answered notifications usually decreases on friday, saturday and sunday. To help you with the interpretation of this chart, a second line shows you the ideal number of answered notifications per day.
Top 10 of the most common answers
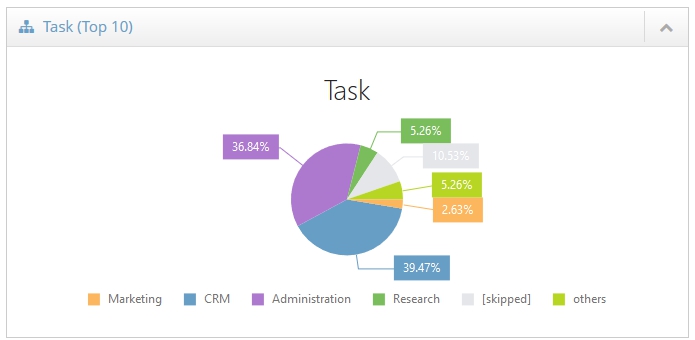
A pie chart shows the 10 most common answers to each question of your study. Every answer has a different colour. Below the pie chart you will find a legend explaining all answers and colours. If necessary, you may hide answers by clicking them. The pie chart will then adapt to your selection. To show a hidden answer simply click it again.