")
")
")
Participant Activities
A summary of a participant's activity is available offering you in-depth information about your multimomentanalysis. If you ever experience any problems during your study, this view may be extremely helpful. Go to Project Setup > Participants. Look for the participant you want to monitor and click the eye symbol ![]() to access the monitoring of this participant. Three different tools are available and offer great insights to your participant's activity. Please be aware, that the monitoring tools are only working during the test and running phase of your multimomentanalysis.
to access the monitoring of this participant. Three different tools are available and offer great insights to your participant's activity. Please be aware, that the monitoring tools are only working during the test and running phase of your multimomentanalysis.
Performance Indicators
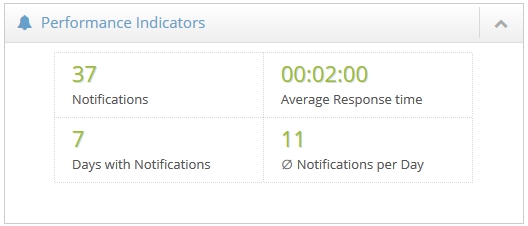
This tool contains multiple indicators that help you assess the quality of your multimomentanalysis. The following information are provided by this tool:
Notifications: The total number of answered notifications.
Average Response Time: The average amount of time it takes this participant to answer a notification.
Days with Notifications: The total amount of days during which this participant answered notifications.
Average Notifications per Day: The average number of answered notifications by day.
Notations per Day
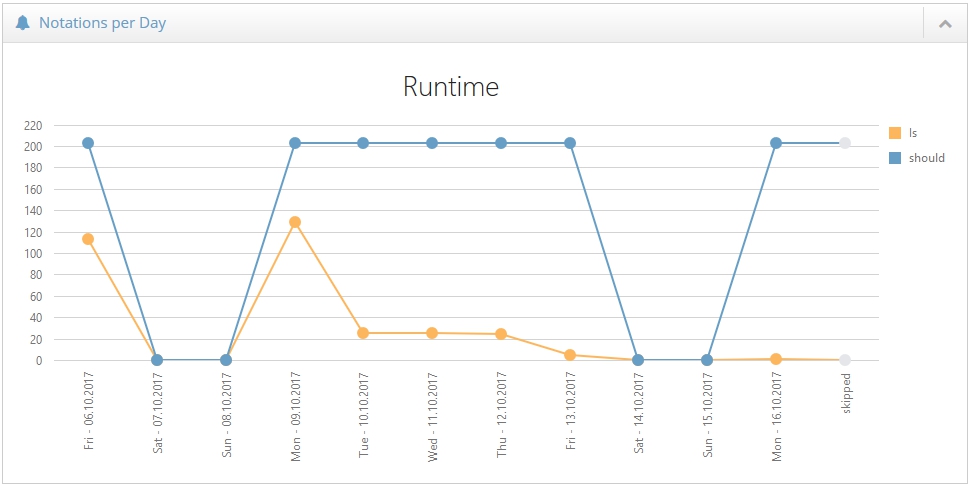
The notations per day are visualised using a line chart. It displays the total amount of answered notifications in the last few weeks. This chart helps you discovering days with increased activity as well as days on which your participant is less active. The total number of answered notifications usually decreases on friday, saturday and sunday. To help you with the interpretation of this chart, a second line shows you the ideal number of answered notifications per day.
Top 10 of the most common answers
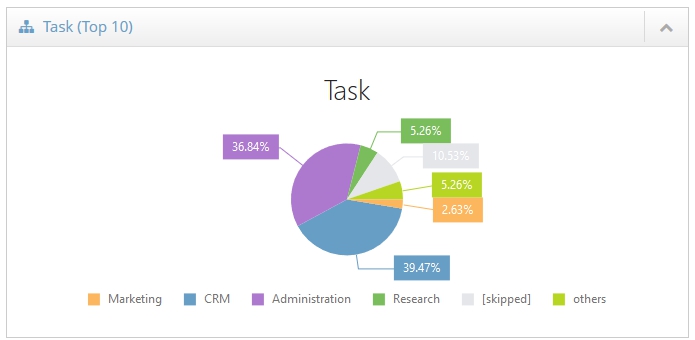
A pie chart shows the 10 most common answers to each question of your study. Every answer has a different colour. Below the pie chart you will find a legend explaining all answers and colours. If necessary, you may hide answers by clicking them. The pie chart will then adapt to your selection. To show a hidden answer simply click it again.